COVID-19 IMPACT: School District Operational Status. Updates for Spring 2022
COVID-19 IMPACT: School District Operational Status
Updates for Fall 2022
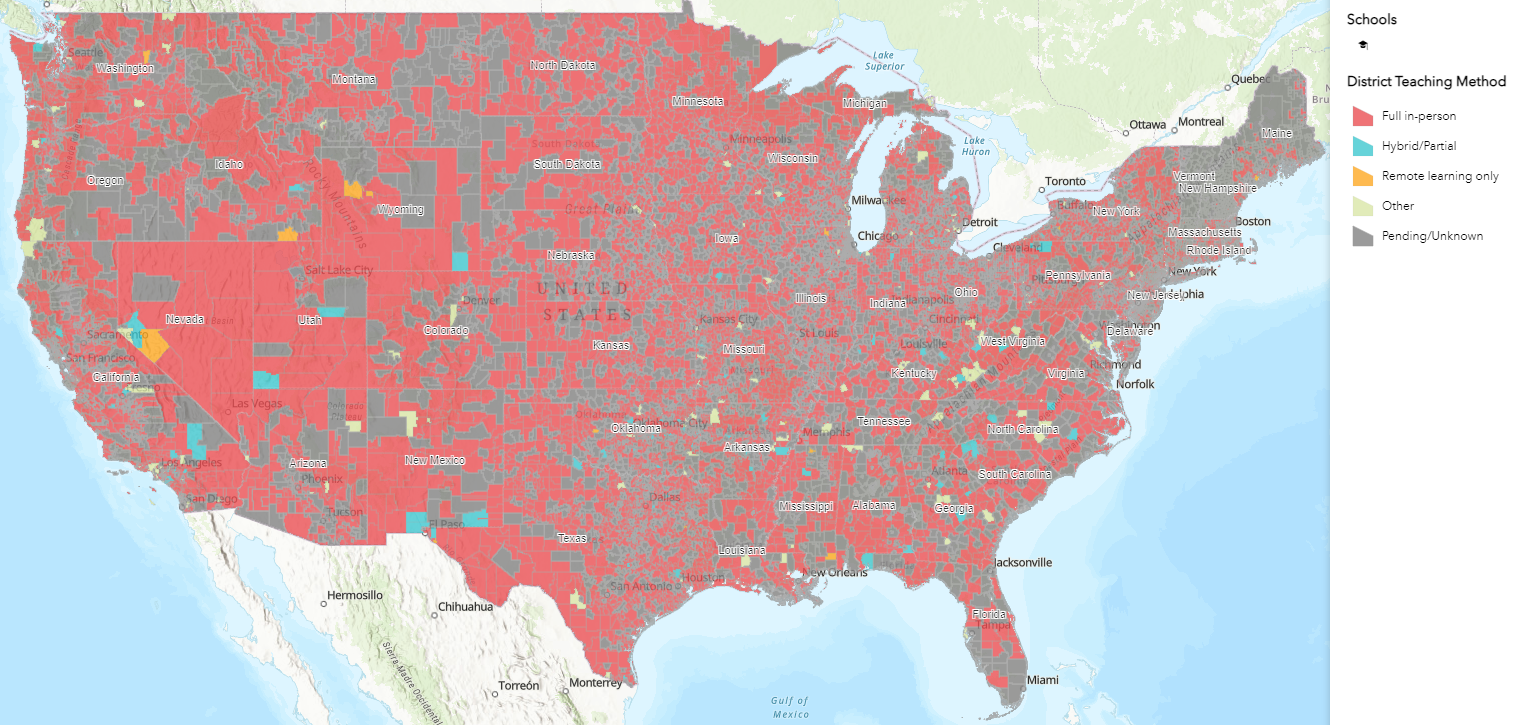
In partnership with Esri and the Centers for Disease Control (CDC), we’ve created the information below to keep you informed of the changes and impact of COVID-19 on school operational plans at the district level. The previous survey’s results (Fall 2020, Spring 2021, Fall 2021, and Spring 2022) remain available in the download section.

MCH is staying on top of emerging changes in the K12 community during this unprecedented time.
As the COVID-19 situation continues to evolve, our tactics to monitor and track its impact follow suit. Initially, policies surrounding COVID-19 were made at the state level and we configured our data compilation process based on that standard. More recently, however, the increase in local policy making surrounding COVID-19 has made it necessary to restructure our compilation process to maintain the high-quality data you need and expect.
In collaboration with multiple public and private stakeholders, MCH has invested significant resources into a strategy to continuously compile and refresh the below K12 public school data at the district level. We are offering this valuable resource as a free service to help you stay informed of the continuing changes to school district operational plans as the COVID-19 virus continues to impact our nation.
9,840 (60%) of districts out of a total of 16,316 have provided their survey responses.
| 2,210 (22%) of districts offer universal free lunch to students. |
| 2,342 (24%) of districts offer universal free breakfast to students. |
| 9,296 (95%) of districts offer full in-person classes. |
| 40 (0%) of districts offer remote learning only. |
| 154 (2%) of districts offer hybrid learning. |
| 150 (2%) of districts require all teachers and staff to wear masks on premises. |
| 615 (7%) of districts require unvaccinated teachers and staff to wear masks on premises. |
| 140 (2%) of districts require all students to wear masks on premises. |
| 579 (6%) of districts require unvaccinated students to wear masks on premises. |
| 449 (5%) of districts perform Covid testing on teachers and staff. |
| 342 (4%) of districts perform Covid testing on students. |
| 403 (5%) of districts require all teachers and staff to be vaccinated. |
| 122 (1%) of districts require all age-eligible students to be vaccinated. |
Additional COVID-19 School Resources
Centers for Disease Control and Prevention CDC Contact Information U.S. Department of Education World Health Organization Johns Hopkins University and Medicine – Coronavirus Resource Center ESRI COVID-19 Resources Where will all those K-12 dollars go? MCH asked an expert. What Congressional Covid Funding Means for K-12 Schools Yes, K-12 schools are spending relief funds.
Individual district data available by clicking the button below.
Available for download in excel or via RESTful API.
Great Today. Better Tomorrow.
MCH will continue to survey districts throughout the school year adding robust and timely information to this resource. School learning models and screening programs are just two of the many critical data points we are tracking. This data will be used by businesses and government agencies, like the CDC, to understand the ongoing impacts of COVID-19 in school districts. Login and download the most updated version anytime, for free.
Create a Free Account
Login
Download for Free Anytime
| State Name | District Count | Enrollment Total | Full In-Person Percent | Remote Only Percent | Hybrid Percent | Other Percent | Unknown Percent | Pending Percent |
|---|---|---|---|---|---|---|---|---|
| Alabama | 161 | 794088 | 49% | 0% | 1% | 0% | 0% | 47% |
| Alaska | 54 | 136562 | 40% | 1% | 1% | 0% | 0% | 55% |
| Arizona | 639 | 1213648 | 40% | 0% | 2% | 1% | 0% | 54% |
| Arkansas | 270 | 512486 | 53% | 0% | 2% | 1% | 1% | 39% |
| California | 1057 | 6744058 | 64% | 0% | 2% | 2% | 0% | 30% |
| Colorado | 181 | 923845 | 59% | 0% | 0% | 2% | 1% | 37% |
| Connecticut | 187 | 548475 | 58% | 0% | 0% | 0% | 0% | 41% |
| Delaware | 42 | 145666 | 47% | 0% | 2% | 0% | 0% | 50% |
| Florida | 77 | 3019052 | 40% | 0% | 1% | 1% | 2% | 54% |
| Georgia | 219 | 1843045 | 52% | 0% | 2% | 3% | 0% | 42% |
| Idaho | 174 | 313399 | 44% | 0% | 2% | 0% | 0% | 51% |
| Illinois | 879 | 2023063 | 58% | 0% | 0% | 0% | 0% | 41% |
| Indiana | 407 | 1086495 | 50% | 0% | 0% | 1% | 0% | 46% |
| Iowa | 327 | 527306 | 66% | 0% | 0% | 1% | 0% | 31% |
| Kansas | 289 | 503044 | 68% | 0% | 0% | 0% | 0% | 31% |
| Kentucky | 175 | 737337 | 58% | 0% | 1% | 3% | 0% | 36% |
| Louisiana | 151 | 734665 | 52% | 0% | 0% | 1% | 0% | 44% |
| Maine | 252 | 198239 | 38% | 0% | 0% | 0% | 0% | 60% |
| Maryland | 26 | 927510 | 42% | 0% | 0% | 3% | 0% | 53% |
| Massachusetts | 398 | 976368 | 51% | 0% | 0% | 0% | 0% | 47% |
| Michigan | 825 | 1546330 | 51% | 0% | 1% | 2% | 0% | 44% |
| Minnesota | 508 | 920424 | 65% | 0% | 0% | 0% | 0% | 33% |
| Mississippi | 152 | 513657 | 54% | 1% | 0% | 0% | 0% | 42% |
| Missouri | 557 | 965210 | 65% | 0% | 0% | 1% | 0% | 32% |
| Montana | 397 | 156702 | 48% | 0% | 0% | 0% | 0% | 49% |
| Nebraska | 259 | 329399 | 63% | 0% | 0% | 0% | 0% | 36% |
| Nevada | 25 | 459149 | 52% | 4% | 8% | 4% | 0% | 32% |
| New Hampshire | 136 | 190749 | 10% | 0% | 0% | 0% | 0% | 88% |
| New Jersey | 652 | 1420615 | 56% | 0% | 0% | 0% | 0% | 42% |
| New Mexico | 147 | 343792 | 64% | 0% | 2% | 2% | 0% | 29% |
| New York | 982 | 2759942 | 59% | 0% | 0% | 0% | 0% | 39% |
| North Carolina | 328 | 1626194 | 49% | 0% | 1% | 1% | 0% | 47% |
| North Dakota | 181 | 119461 | 65% | 0% | 0% | 0% | 0% | 34% |
| Ohio | 683 | 1697740 | 57% | 0% | 0% | 1% | 0% | 40% |
| Oklahoma | 566 | 736318 | 56% | 0% | 2% | 1% | 0% | 39% |
| Oregon | 198 | 589309 | 63% | 0% | 1% | 1% | 1% | 32% |
| Pennsylvania | 745 | 1808697 | 53% | 0% | 0% | 1% | 0% | 43% |
| Rhode Island | 62 | 144876 | 56% | 1% | 1% | 1% | 0% | 38% |
| South Carolina | 90 | 846669 | 52% | 0% | 2% | 0% | 1% | 44% |
| South Dakota | 168 | 153358 | 66% | 0% | 0% | 0% | 0% | 32% |
| Tennessee | 150 | 1045069 | 50% | 0% | 0% | 2% | 2% | 45% |
| Texas | 1211 | 5661911 | 68% | 0% | 0% | 0% | 0% | 29% |
| Utah | 156 | 687768 | 60% | 1% | 1% | 0% | 1% | 33% |
| Vermont | 52 | 87280 | 5% | 0% | 0% | 0% | 0% | 94% |
| Virginia | 182 | 1367495 | 39% | 0% | 0% | 2% | 0% | 58% |
| Washington | 315 | 1144826 | 67% | 0% | 0% | 2% | 0% | 28% |
| Washington DC | 62 | 91381 | 53% | 1% | 6% | 6% | 0% | 32% |
| West Virginia | 60 | 285412 | 56% | 0% | 3% | 5% | 1% | 33% |
| Wisconsin | 444 | 872074 | 64% | 0% | 0% | 1% | 0% | 33% |
| Wyoming | 55 | 94970 | 60% | 1% | 1% | 0% | 0% | 36% |
For general and press inquiries, please feel free to contact us
Share
Exceptions can be made for the following categories of people:
- A person who cannot wear a mask, or cannot safely wear a mask, because of a disability as defined by the Americans with Disabilities Act (ADA) (42 U.S.C. 12101 et seq.). Discuss the possibility of reasonable accommodation with workers who are unable to wear or have difficulty wearing certain types of masks because of a disability.
- A person for whom wearing a mask would create a risk to workplace health, safety, or job duty as determined by the relevant workplace safety guidelines or federal regulations.
In K-12 schools, screening testing can help promptly identify and isolate cases, quarantine those who may have been exposed to COVID-19 and are not fully vaccinated, and identify clusters to reduce the risk to in-person education. CDC guidance provides that people who are fully vaccinated do not need to participate in screening testing and do not need to quarantine if they do not have any symptoms. Decisions regarding screening testing may be made at the state or local level.
Learn more about TTS in the Science Brief and COVID-19 Testing in Schools.
Fully vaccinated close contacts should be referred for COVID-19 testing. If asymptomatic, fully vaccinated close contacts do not need to quarantine at home following an exposure (they can continue to attend school in-person and participate in other activities). In addition to correctly wearing masks in school, they should wear a mask in other indoor public settings for 14 days or until they receive a negative test result.
Close contacts who are not fully vaccinated should be referred for COVID-19 testing. Regardless of test result, they should quarantine at home for 14 days after exposure. Options to shorten quarantine provide acceptable alternatives of a 10-day quarantine or a 7-day quarantine combined with testing and a negative test result.
See the added exception in the close contact definition for the exclusion of students in the K-12 indoor classroom who are within 3 to 6 feet of an infected student with masking. See the Department of Education’s Protecting Student Privacy FERPA and the Coronavirus Disease 2019 for more information.
Schools should report, to the extent allowable by applicable privacy laws, new diagnoses of COVID-19 to their state or local health department as soon as they are informed. School officials should notify, to the extent allowable by applicable privacy laws, teachers, staff, and families of students who were close contacts as soon as possible (within the same day if possible) after they are notified that someone in the school has tested positive.
A distance of at least 6 feet is recommended between students and teachers/staff, and between teachers/staff who are not fully vaccinated. Mask use by all students, teachers, staff, and visitors is particularly important when physical distance cannot be maintained.


Need More Time?
Due to inactivity, you will be logged out within 5 minutes.
To stay logged in, please select Stay Logged In.
 Logout